To produce educational content on a stand-alone basis, you can use a handy fact sheet, but you can also use a process diagram (also called workflow or flow diagram) in the case of discovering how a business works or applying a security procedure, for example.
This folder explains why and how to create a good schema.
What is the purpose of a Process/workflow diagram?
We call plan process a technical drawing (livened up(led) or not) which allows a visual and orderly representation of a flow of generally complex work.
Example: I wish to represent the various stages of validation of an educational course(price) in a company of training(formation).
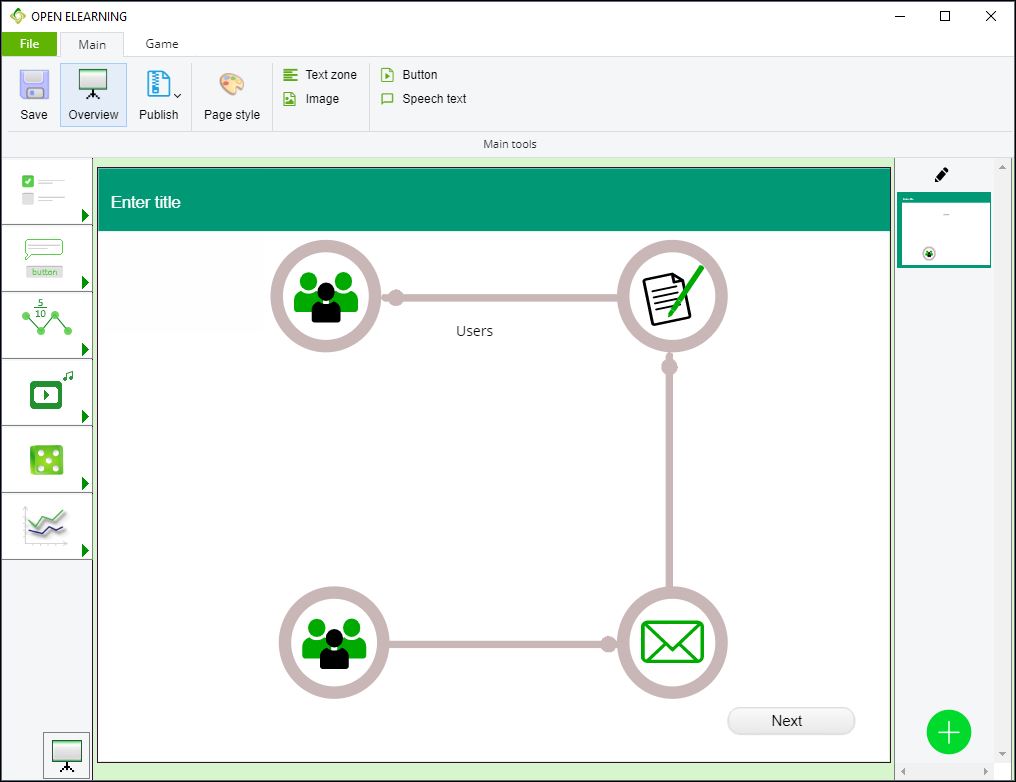
The initial purpose of a representation of a process under its graphic shape is to make understand by the image. The computer graphics of a workflow often appears as an image or the various flows are represented by arrows.
How to create a process graph in the Open eLearning software?
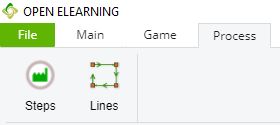
1. Select the tab “Process”
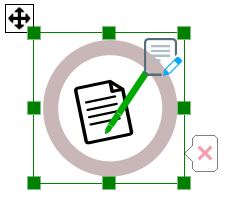
2. Select the tool “Steps” and install one and more step process
3. Select the tool “Lines process”
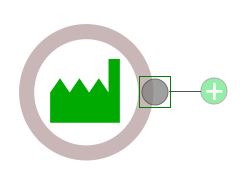
4. Add two additional points using the shortcut to the right of the object